Calibration Data
A question that I seem to receive frequently: “Can you help me with the calibration?”
So, you have a sample. And, there is some chemical in there (like glucose) and you want to know how much glucose is in the sample… maybe you have some idea, it should be less than something, right? Were do you start?
Step 1: You select a test method. You might choose HPLC, UV-VIS, FTIR, etc.
Step 2: Calibrate your machine.
Step 3: Measure your sample
Step 4: Ask, does the result make sense?
Calibrations are done to correct for machine errors and produce correlations that relate things (usually a signal value to a concentration). Most lab equipment in common labs work with Light. A UV-VIs (Spectrophotometer), Refractive Index detector, FTIR, Florescent detector, etc, all use light. The light passes through (or sometimes reflects off) your sample. The amount of the light that does or doesn’t make it past your sample is related to the concentration.
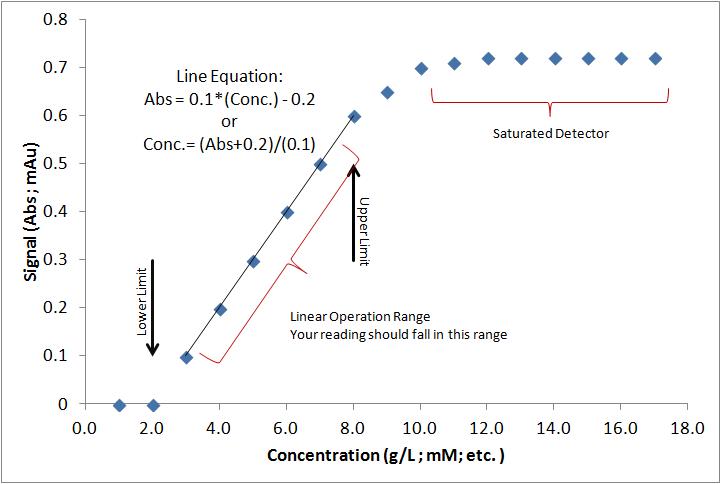
Most detectors have a “Linear Response Rage.” This is the operating condition where the signal is directly related to the amount of material it is measuring. And they have a “Lower Detection Limit” or the smallest amount that they can detect. There is also the “Sensitivity” that is how well it can determine the small differences.
If your sample blocks all the light, the detector maxes out the signal. No matter how much more you put in the way of the light, if all the light is blocked – all the light is blocked – your signal stays the same… at the max. You will need to dilute your sample and reduce the number of molecules that are blocking the light.
Now, if your sample is really dilute or the light is really bright that it doesn’t even notice the sample molecules then the detector says you have nothing there… This is the “Lower Detectable Limit.” The lowest concentration of molecules that are needed for the machine to notice. You might need to concentrate your sample, that is dry off the solvent to make is more concentrated.
Most machines are tuned towards the low end. That means they will detect a very low concentration of molecules. That setup sacrifices the detector’s upper limit. It will be saturated (all the light is blocked) at lower amounts of sample. You can fix this issue by diluting your sample to make it fit within the range that the machine can “see” well. It is much easier to dilute a sample then try to dry it or concentrate it.
We call the typical operating range the “Linear Range.” If you plot the signal as a function of sample concentration, you will actually see a drop off in the signal on the far left, a zone that looks like a line, and a plateau where the light is blocked. See the picture below, if the signal is above 0.65 or below 0.1 the data can’t be used. Also, keep in mind that every machine, test dye, and procedure will require its own calibration curve… don’t use this one here for your data.

So, how do you make the calibration standards?
Maybe you are measuring something easy, glucose… a standard HPLC + Refractive Index Detector (RID) and an H+ Column will work for this test. Your samples are all in water.
Step A: Make a stock solution that you are absolutely certain of the concentration (that is grams per liter) and not amount (grams). These tests work on concentration not absolute amount. To make this solution, use a volumetric flask (these have a line etched in the glass to ensure the correct volume when full). Measure out an amount that your balance can detect (something like 1 gram) and put it into the flask. Now add water (at the temperature stated on the flask – the flask should state the volume of water at the line +/- the accuracy and the temperature for that volume). Now, add the water to the line. Cap. Mix. If you used a 100 mL flask and 1 gram of glucose you have a 10 g/L glucose standard. — By the way, bacteria and fungi eat sugar so, this standard won’t last more than a day or two!
Step B: Dilute the stock solution into known concentrations. The simplest way is by factors of 2. That is you take 10 mL of 10 g/L standard and add 10 mL of water. Now you have a 5 g/L standard. Take 10 mL of that into a new container and add another 10 mL of water. Now you also have a 2.5 g/L standard. Do this a few times… to create a set 10, 5, 2.5, 1.25, 0.625, 0.313, 0.156 g/L You need to use accurate volume measuring devices to do the dilutions. DO NOT WEIGH THE LIQUIDS (you added sugar to the stock, that changes the density and weighing it isn’t accurate unless you measure the density and apply a correction – Likewise make sure all the liquids are at the same temperature when you measure out the volume).
Step C: Test these samples and your unknowns (AT THE SAME TIME). If you are using a colormetric, or wet chemistry where your are measuring UV-VIS absorbance, record the absorbance number. For HPLC, you record the area under the peak (not the peak height). Since, test dyes, columns, light bulbs, your mood, can change with time, you want to test your standards at the same time you test your unknowns… no cheating…
Step D: Plot your data. You plot should look like the one above. If you use Excel, Gnumeric, OpenOffice, Apple Numbers, add a trend line to the linear range. The equation is called your calibration curve (even though it is linear – is called a curve). Normal convention puts the concentration as the x-variable (you set the concentration first) and the signal (or area) as the y-variable (that is dependent on the sample concentration). In practice, it is easier to have the signal (or area) as the x-variable and the concentration as the y-variable (this saves you from doing the algebra).
Step E: Use the calibration curve to convert the area or absorbance of your unknown to the concentration. DONE!
I have included a Excel Calibration Workbook to help you.
Keep in mind that all these methods are based in concentration, not absolute amount. If you need to get to an absolute amount, you need to multiply by a volume term. So, you have a bottle of sugar that is 200 mL… (that is 0.2 L) and you used 10 uL to inject for the HPLC test. The HPLC says it is 2.5 g/L — so, 2.5 g/L * 0.2 L = 0.5 grams sugar in the bottle + some amount of water.
Significant figures & Number of Digits: These are limited to the lowest accuracy device you used. So, if your volumetric flask was only good to 2 digits (+/- 0.02 mL at 20ºC ) your results are only good to 2 places 0.01 (you can’t go about adding more digits). If you think you need more accuracy you need to buy more accurate measuring devices… and then do multiple tests to find out how reproducible you or your machine is… +/- 0.001 is just about the limit for most normal things… if you see extra digits in someone’s data… question them as to why?
If you think you need help, message me on Research Gate.
Good Luck!