Category: Gas MPG
Fuel Tracking – 2016 – End of Year
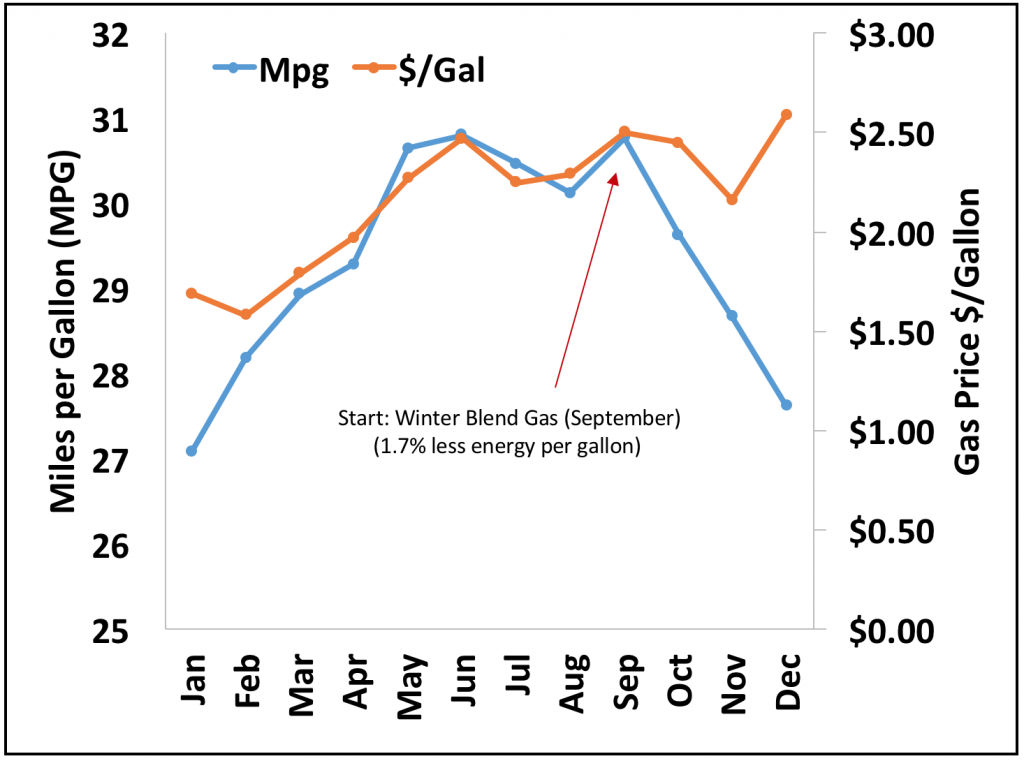
Three months into winter up here in the North and the MPG takes a dive! All 2016 data is based on a highway commute averaging 2,468 ± 247 miles per month. This was done over the same stretch of highway, in the same 2004 V6 Impala LS, with the same driver, at about the same times each day.…
Read MoreFuel Tracking – October 2016 – Chart
Winter reaches the North and we switch to winter blend gas.
Read MoreFuel Tracking – July 2016 – Chart
July Gasoline Use and Statistics: Table Data: *Assumes 10% ethanol for 17.68 lbs-CO2/gallon.
Read MoreFuel Tracking – June 2016 – Chart
June Gasoline Use and Statistics: Since MPG is usually related to operating temperatures, with colder temperatures being less efficient for automobiles. We can see a nearly linear correlation between the average daily temperature and the car’s fuel efficiency (MPG). From this relation we see the MPG is 25.128 plus the temperature times 0.087. Next month, the…
Read MoreFuel Tracking – May 2016
May Gasoline Use and Statistics: *Assumes 10% ethanol for 17.68 lbs-CO2/gallon.
Read MoreFuel Tracking – April 2016
April Gasoline Use and Statistics: *Assumes 10% ethanol for 17.68 lbs-CO2/gallon.
Read More