Author: NVCallow
Fuel Tracking – November 2015
November Gasoline Use and Statistics: *Assumes 10% ethanol for 17.68 lbs-CO2/gallon.
Read More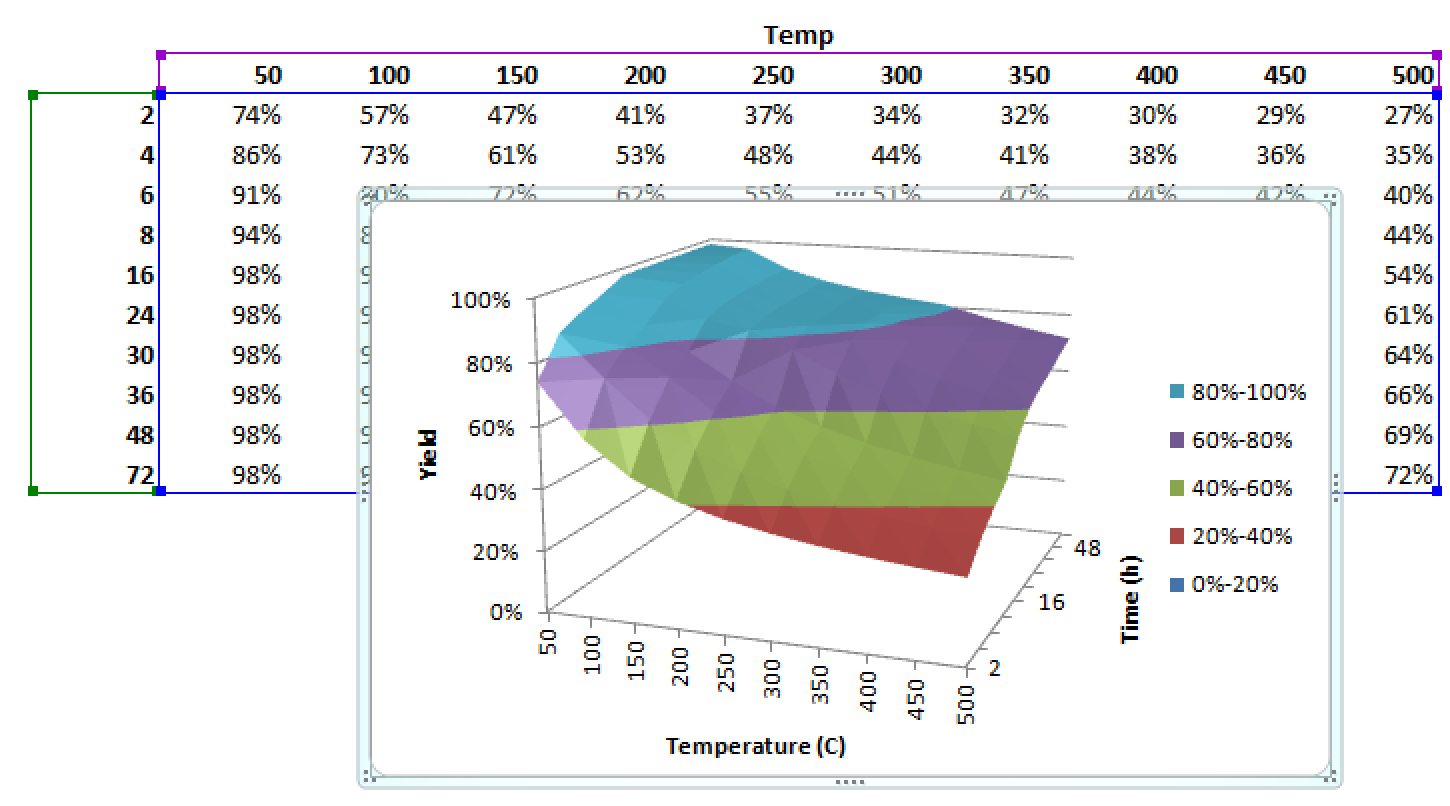
Excel Automation – VBA to Help Make Surface-Plots
Imagine that you have a complicated excel spreadsheet that might have more than one variable and calculates a numerical output. And, you would like to make a surface plot of the result as the two variables change. Surface plots are useful for displaying complicated data that tend to change a function of 2 or more parameters.…
Read More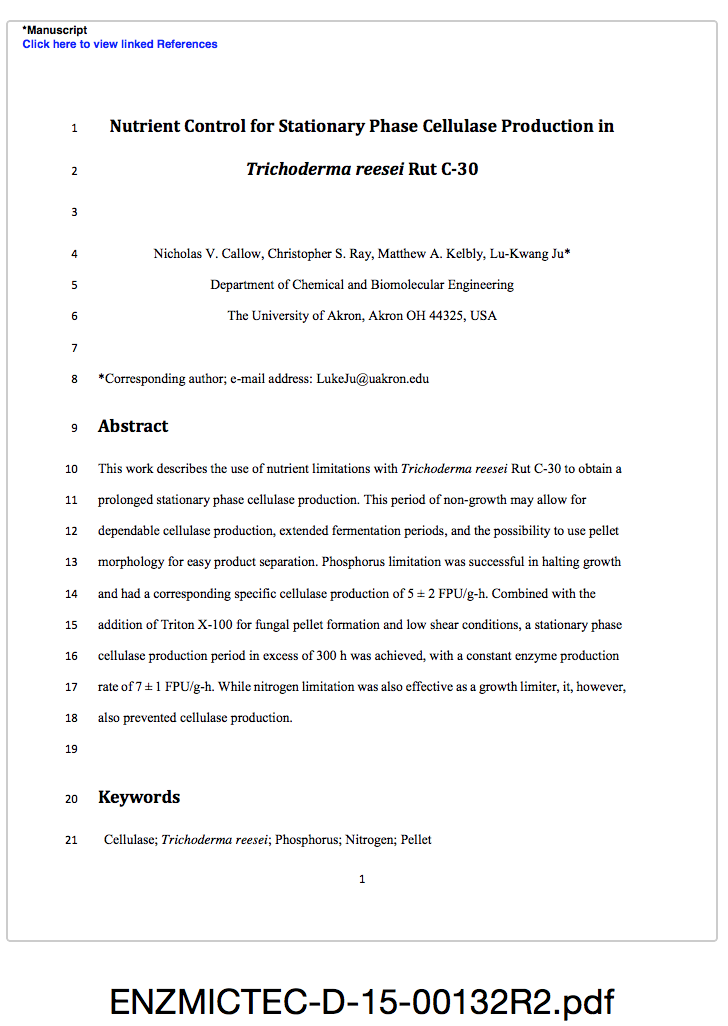
Publication – Lowering the cost of cellulase
There is a new publication that was just accepted for print regarding the production of cellulase. This article is entitled “Nutrient control for stationary phase cellulase production in Trichoderma reesei Rut C-30″ and will appear in the journal Enzyme and Microbial Technology. Cellulase is normally produced by a fungus, Trichoderma ressei. Most of the time the cells continually grow…
Read More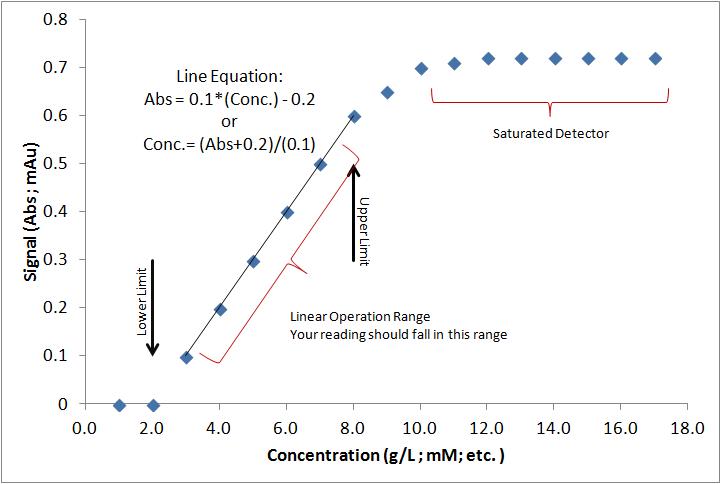
Calibration Data
A question that I seem to receive frequently: “Can you help me with the calibration?” So, you have a sample. And, there is some chemical in there (like glucose) and you want to know how much glucose is in the sample… maybe you have some idea, it should be less than something, right? Were do…
Read More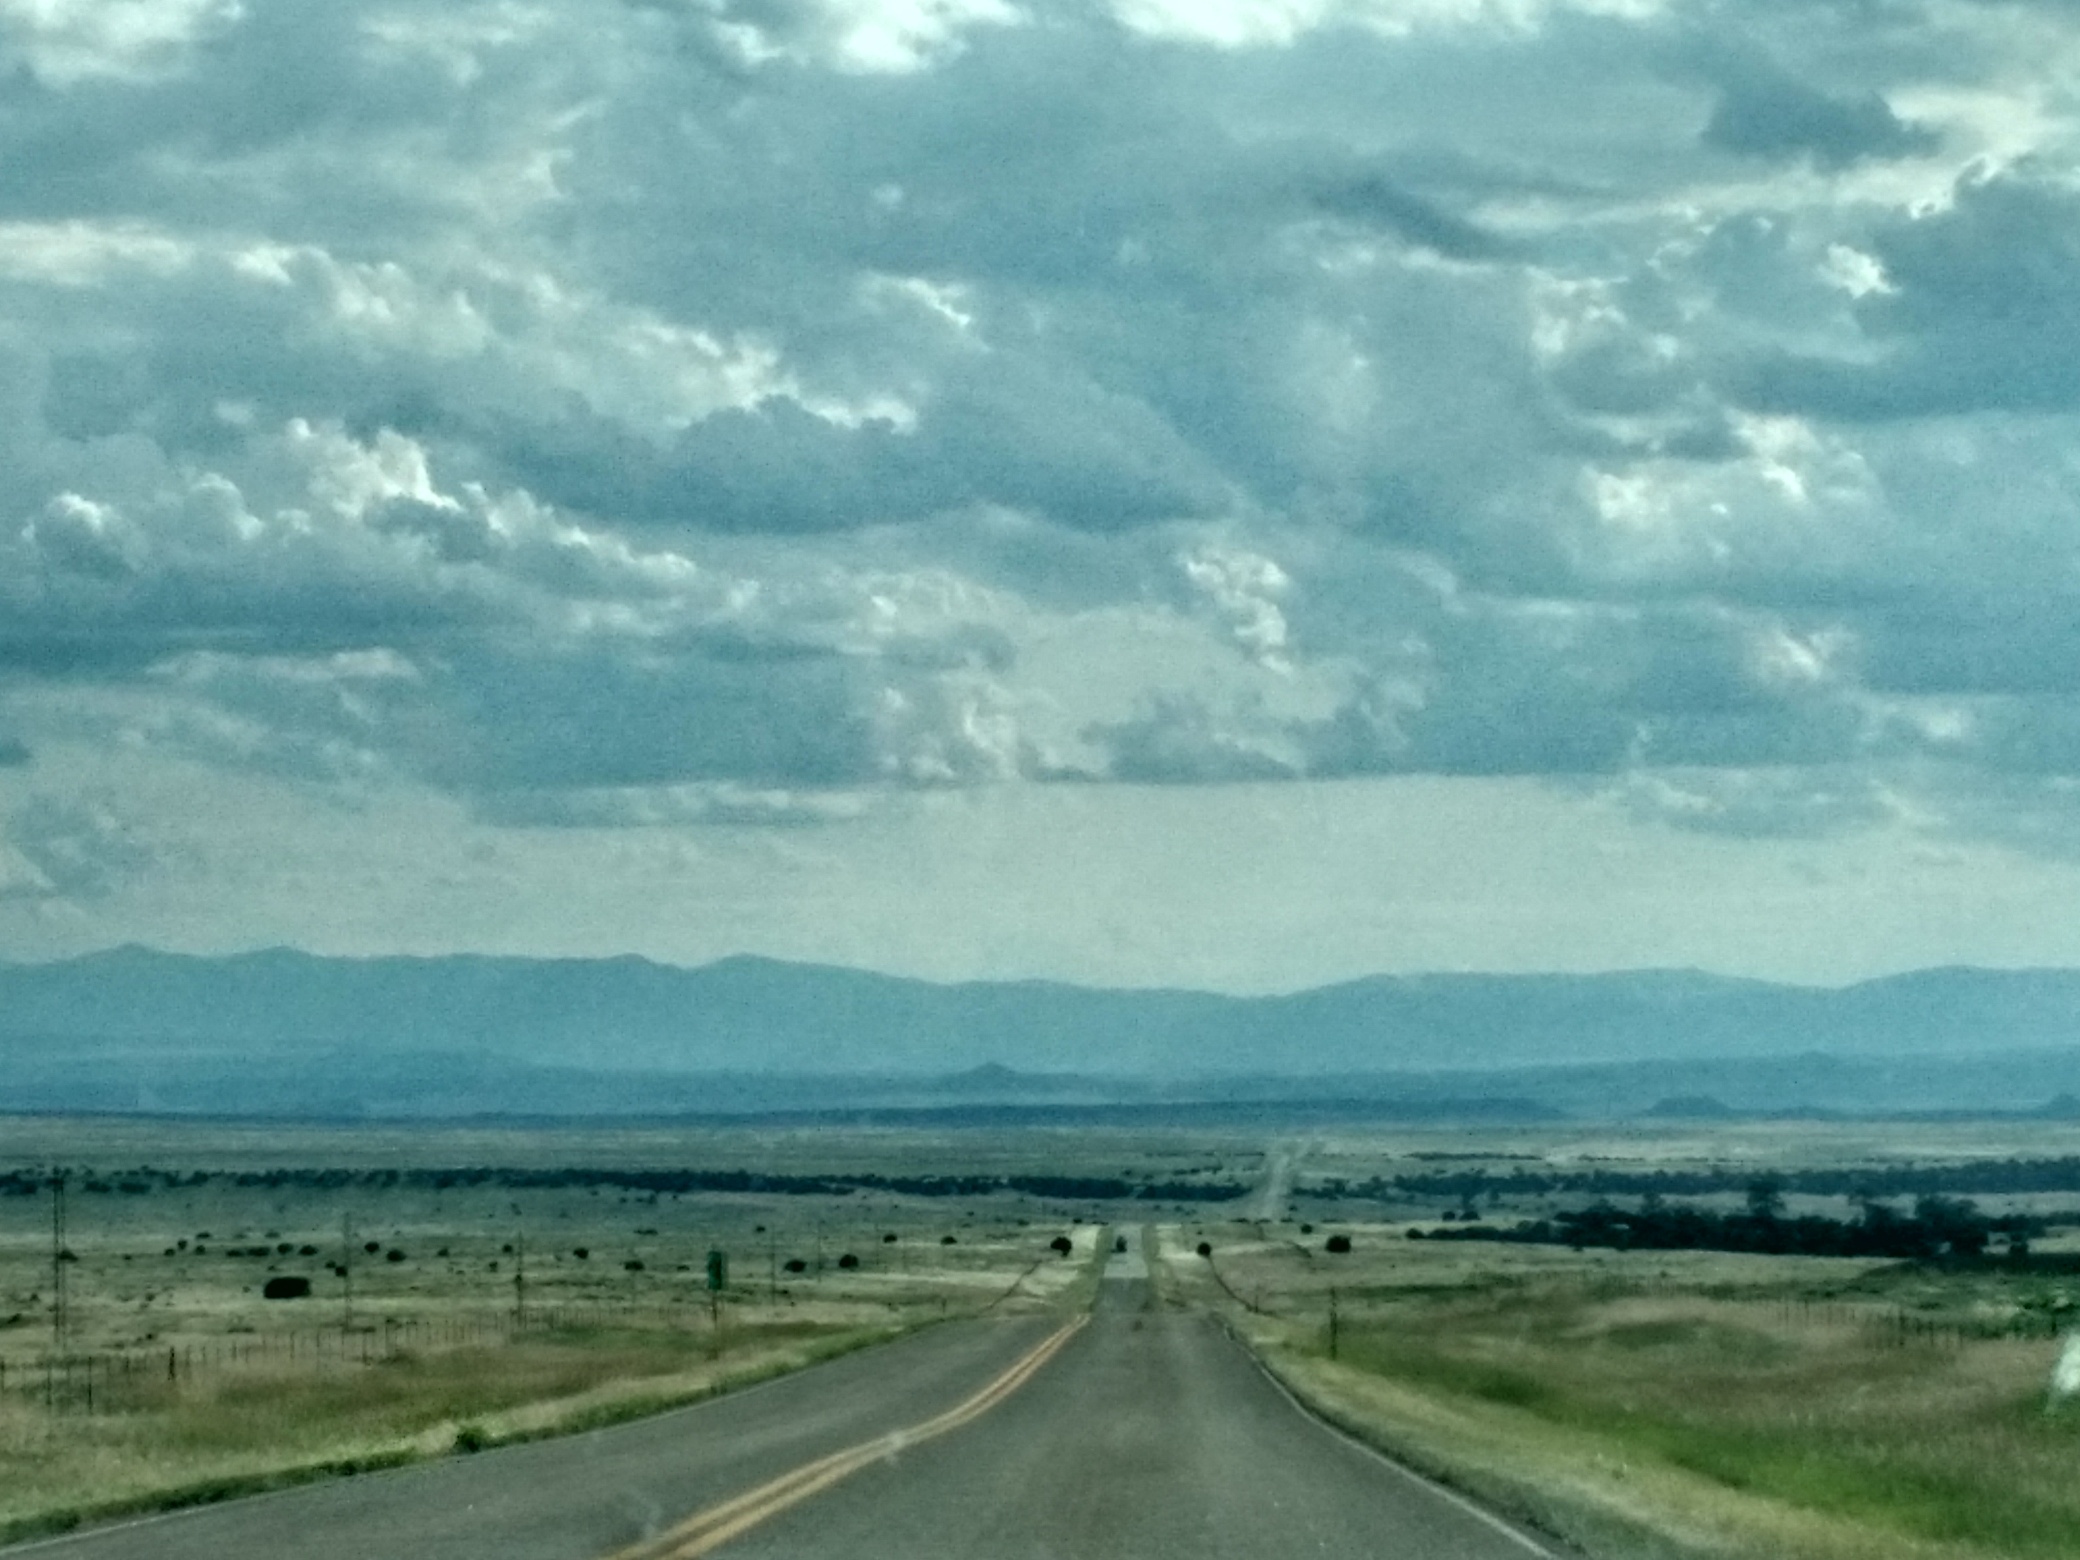
Travel – Day 3 – Drive
Today is Day 3 and the only plan for today is to drive. The plan, go from Kansas City, Kansas to Alamosa, Colorado. That is 670 miles. Take I-70 to Rt 40, then to 287, to 96 to Rt 10 and finally 160. People, gas stations, lunch at McDonald’s, I-70 was like any other rolling…
Read MoreTravel – Day 2 – St. Louis
Today we departed from the Ohio/Indiana border and drove West. The goal for today? To tour the “Gateway to the West.” That is the St. Louis Archway. This is a 630 ft tall stainless steal monument that was built to signify the westward expansion. We drove about 6 hours, non-stop through Indiana and Illinois. In…
Read More